Dashboards are everywhere. Business and IT teams use them to track metrics, visualize trends, and make decisions. But when working with real-time data from Apache Kafka, it’s not obvious how to connect dashboards to the stream or whether you should at all.
The conversation often jumps to technical options like Flink SQL, Kafka Streams Interactive Queries, or Confluent’s TableFlow. Others try to build interactive dashboards directly on top of Kafka topics using a JDBC connector into a database and a Business Intelligence tool. But that only makes sense once the actual goal is clear.
What is the business trying to do with the data? Dashboards are not always the right tool. Automation, smart agents, or process intelligence often deliver more value. Let’s unpack the bigger picture.
This blog post breaks down the different types of queries on Apache Kafka data, when dashboards make sense, and why a context engine often plays a key role.
Join the data streaming community and stay informed about new blog posts by subscribing to my newsletter and follow me on LinkedIn or X (former Twitter) to stay in touch. And make sure to download my free book about data streaming use cases, including various Kafka patterns and scenarios for IT modernization, data sharing, microservices, and many more.
Why Dashboards — And When Not To Use Them
Dashboards give people visual access to data. They support decisions, reporting, and oversight. But not all data needs to be visualized.
Dashboards make sense when
- business users want a regular view on changing data
- teams need to investigate operational metrics
- there is a requirement for manual filtering and inspection
But in many cases, dashboards are not the best answer. For example
- a machine overheating should trigger an alert, not wait for someone to look at a graph
- a fraud detection system should act instantly, not visualize the anomaly
- an AI agent monitoring supply chains should get structured context, not a dashboard snapshot
In these scenarios, dashboards are a fallback. The real need is action or automation, not visualization.
This is where Agentic AI and process intelligence come into play. AI agents require structured, fresh context. They do not use dashboards. They consume streaming data, apply logic or reasoning, and trigger downstream actions. Dashboards might still be used to audit what happened but not to drive the process itself.
So before jumping into dashboard tools, first ask
Is this data for a human to observe or a system to act on?
Foundations First: Apache Kafka, Event Streaming, Data Products, and Governance
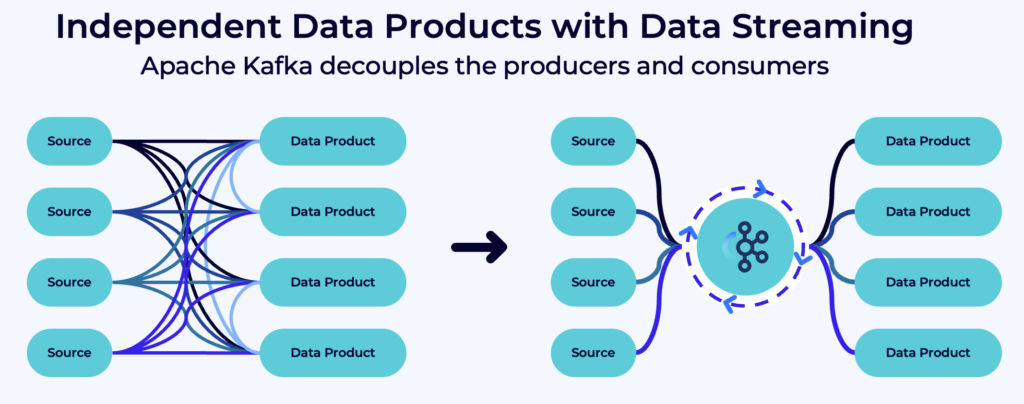
Apache Kafka is the core of modern event-driven architecture. It enables systems to stream events in real time, such as customer interactions, machine signals, backend transactions, or system logs. Unlike batch pipelines, event streaming allows continuous data flow across the business. This supports responsive applications, automation, and real-time analytics.
But fast data is not enough. Real-time value depends on reliable data. That’s why many teams now treat Kafka topics as data products. Each stream should have a clear owner, a defined schema, and a contract between producers and consumers.
Schemas must be versioned and validated. Metadata must be consistent and available. Lineage, access control, and quality checks are critical to avoid downstream errors. Without this foundation, queries will return incorrect results, and automation may act on bad signals.
Governance, schema control, and product thinking are not extras. They are required to build trustworthy systems on streaming data.
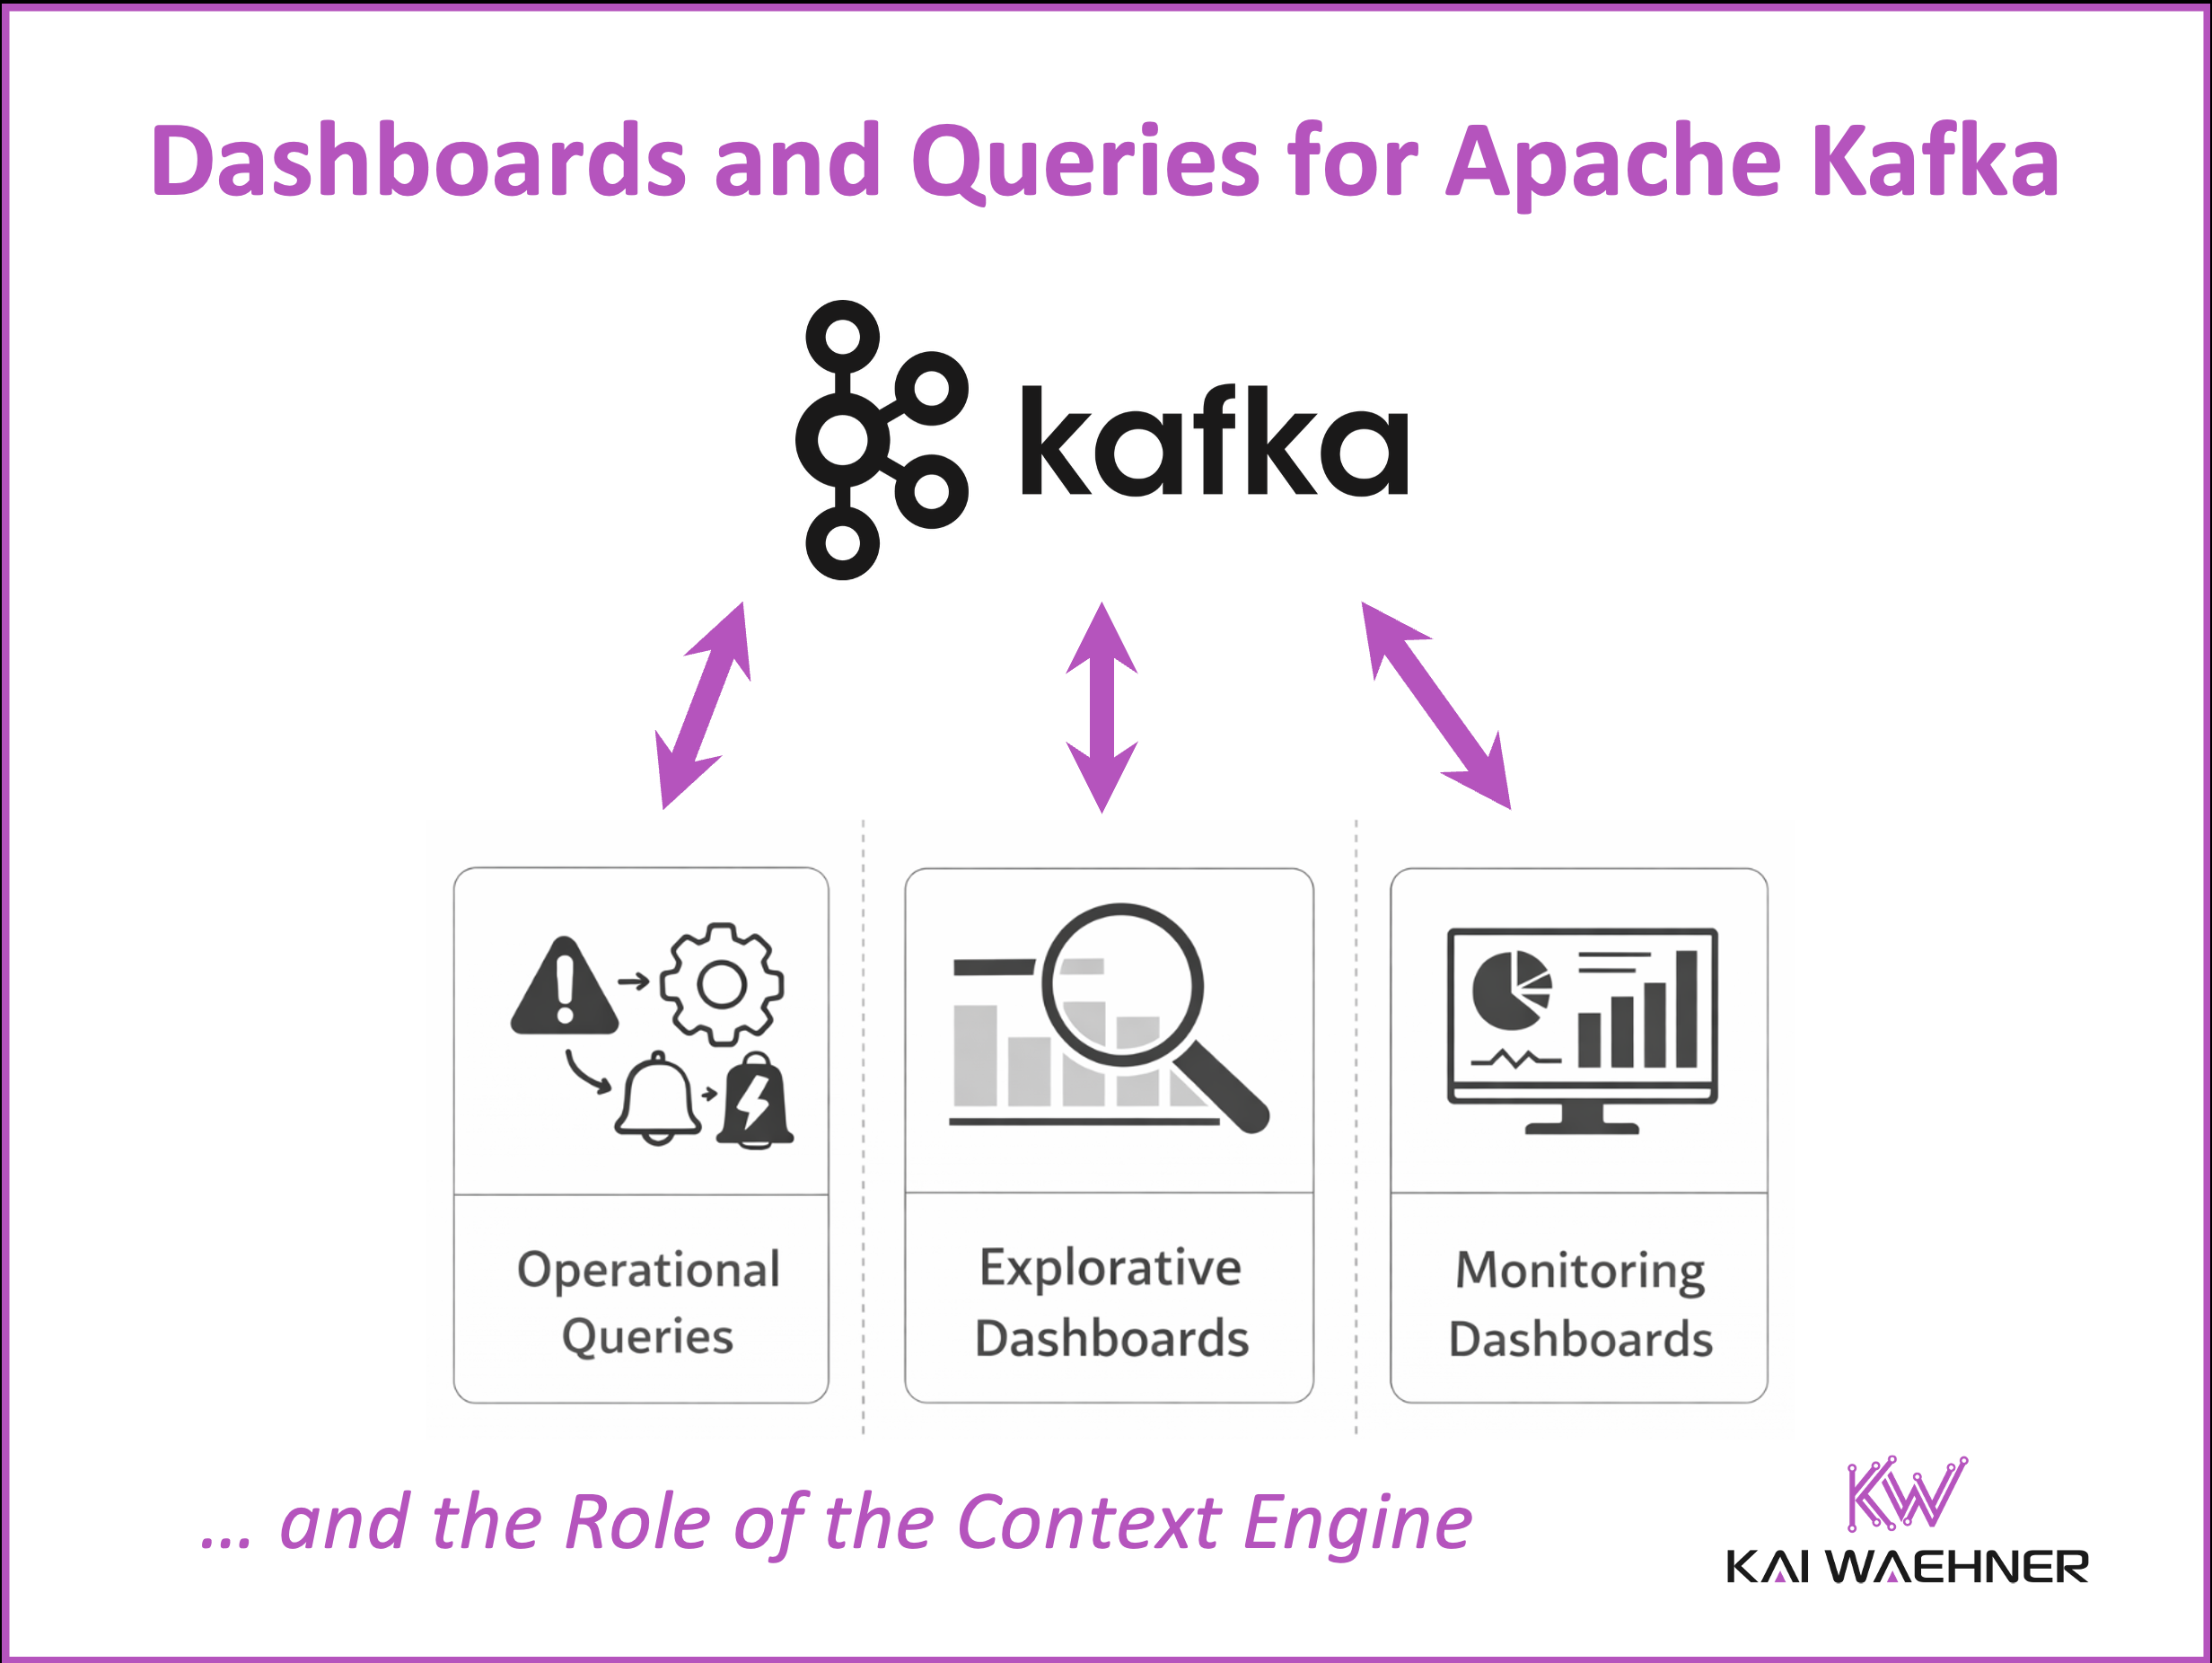
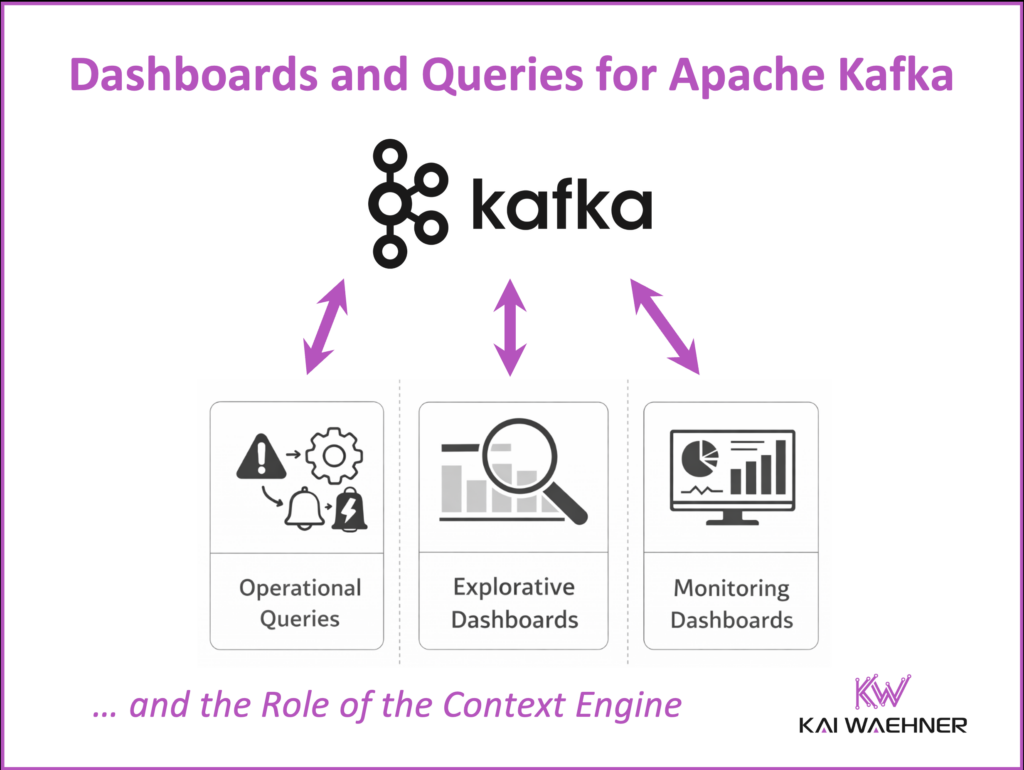
Three Kinds of Queries for Apache Kafka Events
If a dashboard is needed, the next step is understanding the type of query behind it. This helps define the right technical setup.
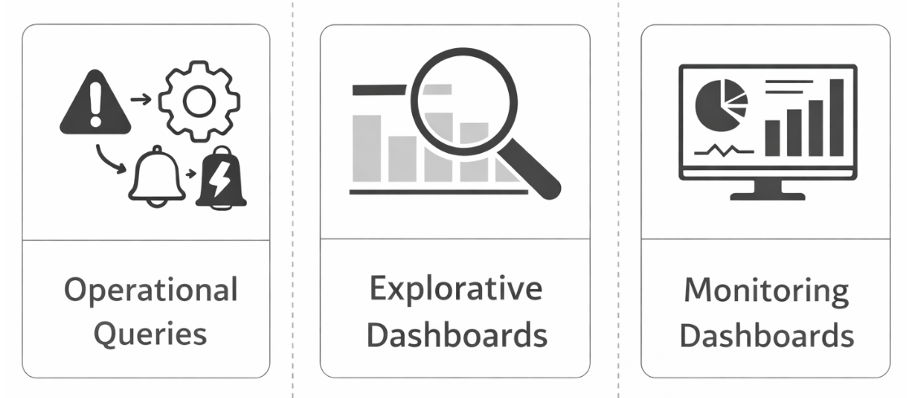
Operational Queries
These are fully automated. They respond to events and trigger actions. Think of them as the nervous system of an application.
They are built directly into stream processing applications using Apache Flink or Kafka Streams. The logic is reactive and runs continuously.
These systems are part of mission critical operations. They must be highly available, fault tolerant, and operate with minimal latency. Any downtime or delay can disrupt core business processes.
A modern data streaming platform that augments Kafka and Flink with on the fly table serving, snapshot queries, and a context engine, helps close this gap between streaming and interactive exploration.
Example use cases include raising alerts on thresholds, aggregating orders for reporting, or triggering workflows. These systems should not rely on dashboards.
Explorative Queries
These are used by people to explore the data. They are ad hoc, flexible, and interactive.
This type of query is difficult to support directly on Apache Kafka. Kafka is optimized for high throughput event streaming and acts as an immutable event log. It provides a durable persistence layer and decouples producers from consumers, which makes it ideal for data pipelines and ensuring data consistency across real-time and batch systems. However, it is not designed for indexed lookups or ad hoc filtering across large datasets. Kafka does not offer queryable storage, secondary indexes, or snapshot consistency, all of which are essential for interactive exploration.
Flink can process the data, but it does not offer indexed access. That makes joins or drilldowns inefficient without an external engine.
Explorative queries are often run in SQL workbenches, BI tools like Superset, or analytical engines like Druid and ClickHouse. They are useful for finding anomalies, trying out new logic, or investigating correlations.
They require indexing, snapshot consistency, and historical access.
Example use cases include joining marketing and sales events to find conversion patterns, analyzing user journeys through digital platforms, or testing new business rules across historical data. These queries typically require interactive tools and should not rely on stream processing systems alone.
Monitoring Dashboards
This use case is simpler but more common. The goal is to display filtered, consistent and up-to-date data to end users.
It does not involve complex joins or deep exploration. Instead, dashboards show metrics from recent data, business KPIs, or precomputed aggregations.
Tools used here include Power BI, Grafana, or custom frontends connected to Flink or TableFlow. Dashboards in this case should be thin and rely on upstream systems for logic.
Example use cases include showing live production status on a factory screen, displaying transaction volumes in a finance dashboard, or visualizing the health of streaming pipelines for operations teams. These dashboards are read-only and should not contain business logic.
What Businesses Really Need Today
While use cases vary, a few patterns repeat across industries. These needs can guide architecture decisions.
- Lightweight dashboards with filtering but no complex joins: Power BI and Grafana are the most common tools. Used for message tracing, monitoring, and status overviews. Users prefer querying externally instead of importing data.
- Real-time data that stays up to date: Dashboards refresh automatically. Data is pushed from Flink or precomputed topics. Materialized views support this, but changing schema can cause frontend problems.
- Business logic belongs upstream: Dashboards should not do computation. Flink or Kafka Streams handle the logic and prepare the data.
- Integration with ML models and agents: Dashboards may show results from predictions or scoring models. These are often trained ML models, not LLMs. Model drift monitoring is gaining interest. LLMs are still early stage in these setups.
- Protocol-agnostic connectors: REST, WebSocket, MQTT, JDBC — all needed. Most organizations expect flexible integration. Sink connectors alone are often not enough. APIs with query parameters are common requests.
The Context Engine: Serving Dashboards and AI Agents from Apache Kafka Events
A powerful pattern is the context engine. It connects Kafka streams to dashboards and AI systems by offering real-time, structured, and indexed access to data.
It works like this
- Flink or Kafka Streams process raw Kafka topics
- Output data flows to context topics
- A service builds indexed views of relevant business objects
- Dashboards and agents query those views through an API

This setup creates a reliable source of truth. Business logic stays in the stream. The context engine focuses on enrichment, access control, and exposing views.
For AI agents, this API layer usually follows the Model Context Protocol (MCP), which is becoming the de facto interface for connecting agents to structured enterprise data. Dashboards, in contrast, are typically served from materialized views in cache or in memory databases, or directly through REST APIs optimized for low latency reads.
Agentic AI systems benefit directly. They consume these views as context to make decisions in real time. Instead of querying raw data or relying on stale batches, they get structured signals. Generative AI also benefits, using the same views as grounding data.
Dashboards and AI agents both rely on fresh, accurate context. A context engine provides that bridge.
Start With the Use Case, Not the Tool
The right dashboard architecture does not start with a tool choice. It starts with business needs.
Ask the right questions
- What decisions or actions should this data support?
- Is the goal observation or automation?
- Does the user need filtering, drilldowns, or live KPIs?
- How fresh must the data be?
- Can the logic run upstream or must it remain flexible?
These answers will guide the setup. Sometimes a simple Power BI dashboard is enough. Other times a context engine or Flink job is required. In many cases, a dashboard is just the user interface to something much more powerful running behind the scenes.
Of course, even when the focus is on business outcomes, a tool still has to be selected. That decision should follow the use case, not drive it. There are many options. Some teams prefer code driven frameworks that give full control and allow deep integration with APIs and AI agent interfaces. Others choose no code or low code tools with prebuilt widgets so business users can create interactive views quickly. Each option comes with trade offs in flexibility, governance, scalability, and integration.
Exploring these tooling choices in depth would fill an entire chapter on its own. The key message here is simple: start with the outcome. The tool is an implementation detail.
Build for the decision, not for the visualization. That is how streaming data creates real business value.
Join the data streaming community and stay informed about new blog posts by subscribing to my newsletter and follow me on LinkedIn or X (former Twitter) to stay in touch. And make sure to download my free book about data streaming use cases, including various Kafka patterns and scenarios for IT modernization, data sharing, microservices, and many more.