Your mission-critical projects need complex event processing, realtime management and monitoring. Talend 5.4 (released in December 2014, https://www.talend.com) offers a great new feature: Talend Event Logging. It allows logging, processing and monitoring of all technical events and business data. In this article, I will focus on how to process, filter and monitor business data. You can find more details about monitoring technical events and logs (e.g. OSGi events of the ESB container) in Talend’s documentation (www.help.talend.com). This new feature is very powerful, but also extendable to fit custom requirements. You can solve and monitor much more complex scenarios than the one I describe here.
Talend Event Logging with Logstash, ElasticSearch and Kibana
First, let’s take a look at the components / projects which are integrated and extended into Talend’s products for implementing this new feature.
logstash (http://logstash.net) is a tool for managing events and logs. You can use it to collect different (distributed) logs, parse them, and store them for later use. Speaking of searching, logstash comes with a simple, but fine web interface for searching and drilling into all of your logs. It uses ElasticSearch under the hood. So, you can easily query through all your logs for specific errors or business analytics (e.g. searching for all lines matching an unique order id).
Additional to the pure collection of events, the Event Logging feature supports custom processing (e.g. custom filtering, customer data enrichment/reduction), aggregation, signing and also server side custom pre- and post-processing of events – e.g. to send them to an intrusion detection system or to any other kind of potential higher level log processing /management system.
Kibana (http://www.elasticsearch.org/overview/kibana) is a browser based analytics and search interface to logstash and other timestamped data sets stored in ElasticSearch. Kibana strives to be easy to get started with, while also being flexible and powerful, just like logstash and ElasticSearch.
Main difference to logstash is a much more powerful HTML5 based web interface. You can
• use multiple concurrent search inputs
• highlight to drill down bar charts
• create line charts, stacked, unstacked, filled or unfilled, with or without points
• create Pie and donut charts that compare top terms or the results of multiple queries
• create custom dashboards with multiple charts
• and much more…
Therefore, logstash, Elasticsearch and Kibana are a perfect combination. You can use Kibana to analyze and monitor your data as you do with logstash, however, Kibana’s web interface is much more powerful and comfortable than logstash.
There is a great book about logstash: “The logstash book” – for just 9.99 USD. I can really recommend this book for getting started: http://www.logstashbook.com/. For Elasticsearch, you can find several books on Amazon. Unfortunately, Kibana has no good and extensive documentation yet. I heard from its developers that this topic is addressed for Q1 2014.
Integration of Event Logging and Monitoring into Talend’s Unified Platform
Talend 5.4 has integrated logstash and Kibana into its Unified Platform. Talend Administration Center (TAC) is Talend’s central web application for management and monitoring. It got a new logging view:
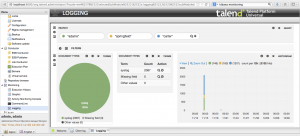 Here, you can use very flexible and powerful realtime search capabilities of Elasticsearch. Some dashboards are available by default. You can also create your own custom dashboards easily within this site thanks to Kibana. Many panel types are available, such as pie, histogram, table, hits or trends. You can analyze every technical event or business data down to the message level:
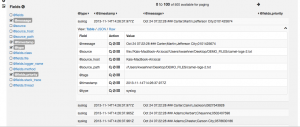 By default, you see fields such as message, source, timestamp, type, and others. Of course, you can also add custom fields suitable for your business case. This way, you have a central monitoring capability which allows analyzing data on distributed clusters easily.
Under the hood, this data comes from logstash. Many alternative inputs are available for logstash, such as log4j input or tcp input. For business data, I often use file input (http://logstash.net/docs/1.2.2/inputs/file) to analyze files such as CSV. Adding new inputs is very simple. You just have to add an input to your logstash configuration file of your logstash server. As I mentioned already, all this is integrated into the Talend’s Unified Platform:
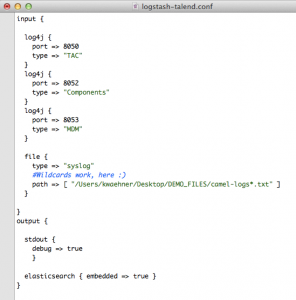 In this example, there are three log4j inputs and one file input. I use the file input to analyze text files in a specific directory. In this case, output is an embedded Elasticsearch instance. In production, you should use an external Elasticsearch cluster, of course. Processing such as filtering can also be configured in this file. Thus, you can process, analyze and monitor all your different inputs within one central monitoring application thanks to Kibana.
Building Talend Integration Jobs, Routes and Web Services
As mentioned before, you can analyze almost all data with logstash, Elasticsearch and Kibana. It does not matter if your input is technical events from a container (e.g. OSGi events) or any business data such as CSV files, log4j logs, or something else. Talend implicitly supports technical events which are created by the ESB container, by MDM, etc. However, you can also add your custom business data from your Talend jobs (integration perspective), SOAP / REST Web Services (integration perspective) or Talend routes (mediation perspective), easily:
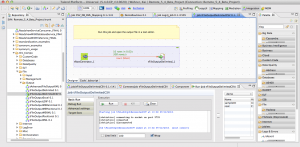 This is just one example (part of Talend’s DI demos which are included in every DI installation). The job generates some random data and stores it to a CSV file. You just have to add the configured file or directory of tFileOutputDelimited to your logstash configuration using file input (with wild cards for more complex scenarios). That’s it. You can now monitor and analyze the business data in realtime. This example showed a Talend DI Job (i.e. ETL job). However, you can also monitor your business data from SOAP / REST Web Services or Talend Routes the same way.
Conclusion
Your mission-critical projects need management and monitoring. Today, this is not just possible with complex and expensive tools of large vendors, but also with Talend’s Unified Platform products such as Talend ESB or Talend MDM. Under the hood, Talend integrates and extends widely used open source products: logstash, Elasticsearch and Kibana. Have fun with Talend 5.4’s new event logging and monitoring features…
Best regards,
Kai Wähner (@KaiWaehner)

