A question every customer asks me: How can you manage and monitor integration routes implemented with Apache Camel (http://camel.apache.org/) and / or Talend ESB (http://en.talend.com/products/esb) (which is based on Apache Camel and also available as open source version). This blog post will show different alternatives to answer this question. The good news first: As Apache Camel and Talend ESB are based on open standards, you can use your own frameworks and tools if tooling of the product is not sufficient. So, I will not talk just about features of Apache Camel or Talend ESB, but also about additional options. Except for Talend Administration Center (user interface on top of Talend ESB’s service monitoring and clustering features), all tools are open source. Talend Administration Center is only available in Talend’s enterprise editions.
Management of Apache Camel and Talend ESB
Let’s begin with management of Apache Camel and Talend ESB routes. I define management as “controlling server instances, services and integration routes”. Besides Talend Administration Center, a Talend-specific web application, several other options exist. I will show jconsole and hawtio. However, as Apache Camel and Talend ESB are standards-based, you can use any other management tool, which supports the Java Management Extensions (JMX) standard, e.g. Hyperic, Nagios or IBM Tivoli.
Talend Administration Center
Talend Administration Center (http://www.talendforge.org/tutorials/tutorial.php?idTuto=54) is a web application to configure and monitor different server instances. Besides, you can install, start and stop Camel routes and SOAP / REST web services.
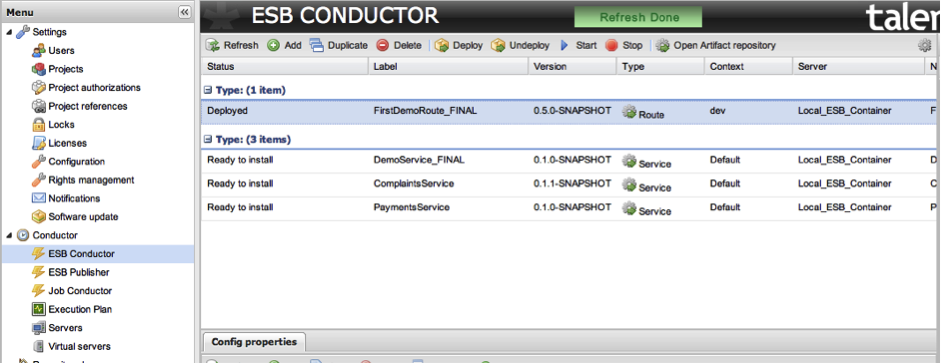
Provisioning (i.e. deploying and managing routes and services on different server instances) can be automated easily because Talend ESB container supports Apache Karaf Cellar, an OSGi addon which is built exactly for this reason. Therefore, you can create so-called “virtual servers” within Talend Administration Center.
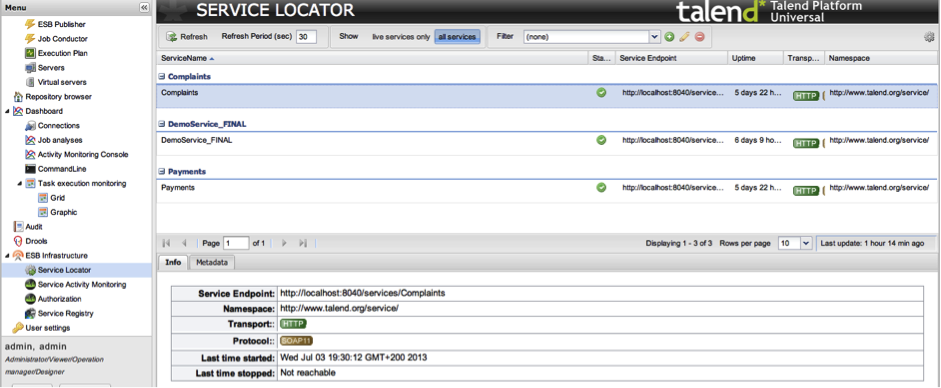
Service locator is another feature, which is based on Apache Zookeeper to implement load balancing and high availability under the hood. Administrators can monitor the state of server instances, Camel routes and REST / SOAP web services within Talend Administration Center.
Since Talend ESB 5.3, Talend Administration Center contains other important enterprise features, especially management of Talend’s new service registry (based on Apache Jackrabbit) for service discovery and policy enforcement, and its new identity management (based on Apache Syncope) for authorization.
Let’s now talk about two other alternatives for managing Camel and Talend ESB via JMX standard interface.
jconsole
jconsole is a graphical monitoring tool to monitor Java Virtual Machine (JVM) and java applications both on a local or remote machine. jconsole uses underlying features of JVM to provide information on performance and resource consumption of applications running on the Java platform using JMX technology. jconsole comes as part of Java Development Kit (JDK) and the graphical console can be started using “jconsole” command.
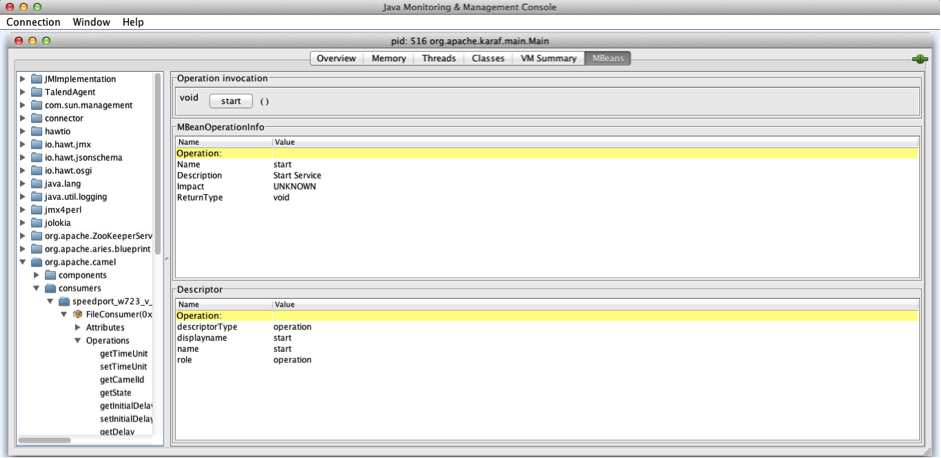
Apache Camel and Talend ESB offer several JMX interfaces to monitor and manage integration routes, endpoints, error handlers, etc. jconsole has a very simple user interface, but is sufficient for some projects.
hawtio
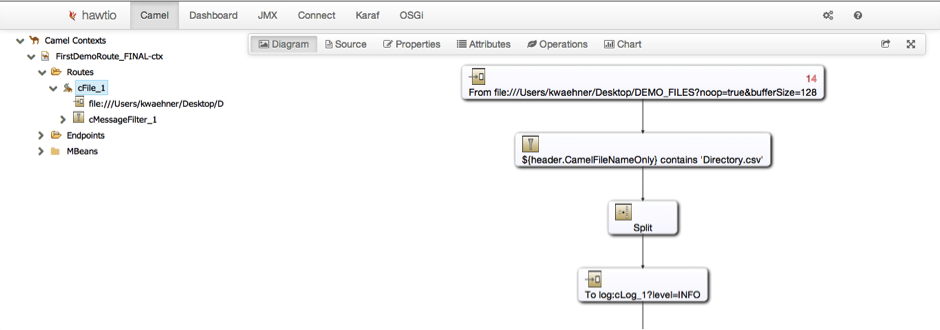
hawtio (http://hawt.io) is a highly modular single-page JavaScript application that fetches JMX metric data using Jolokia, a JMX-HTTP bridge. hawtio is a relatively new tool “on the market”. Nevertheless, it already contains plugins for several different technologies and frameworks such as Apache Camel (integration framework), Apache Karaf (OSGi container), Apache ActiveMQ (JMS messaging) and Apache Tomcat (Java EE web container). As Talend ESB uses respectively supports all of these technologies and frameworks, hawtio is a perfect match, too! hawtio is not “just another jconsole”, but offers some very cool additional features, for example a graphical presentation of Camel routes including real-time monitoring.
hawtio was created by James Strachan (whom else?!) who is the creator of Apache Camel and some other great frameworks. Therefore, at the moment, most contributions come from JBoss (where James works after JBoss’ acquisition of FuseSource last year). In the future, I hope (and expect) to see other companies supporting this great open source project, too.
Monitoring of Apache Camel and Talend ESB
Let’s continue with some monitoring alternatives for Apache Camel and Talend ESB. I define monitoring as “searching and (visually) analyzing state of integration routes and services at runtime”. I will show you Talend’s Service Activity Monitoring for SOAP and REST web services. Besides, you will learn about logstash and Kibana, two awesome open source tools (based on ElasticSearch) for analysis and visualization of any (distributed) log files.
Service Activity Monitoring (Part of Talend Administration Center)
Service Activity Monitoring (SAM, http://www.liquid-reality.de/display/liquid/Talend+ESB+Service+Activity+Monitoring) is part of Talend Administration Center and allows for logging and monitoring SOAP and REST web service calls. For example, SAM could be used for collecting usage statistics and fault monitoring.
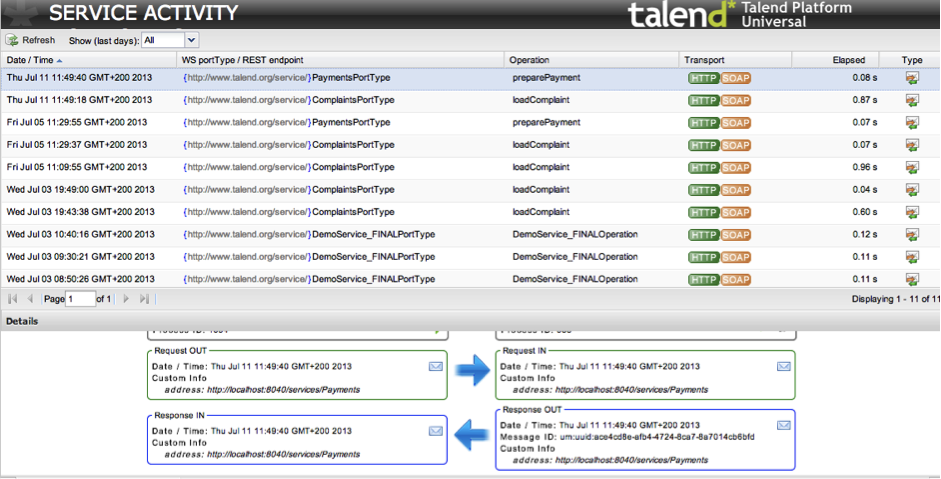
SAM is a part of Talend’s OSGi container and can be installed via a single command. It can be activated for SOAP and REST web service providers and consumers within Talend Studio via a single click. So, without any additional efforts, you can monitor your SOAP and REST web services. You can sort by several different parameters and step into details within Talend Administration Center, i.e. you can look at every incoming request message and outgoing response message.
logstash
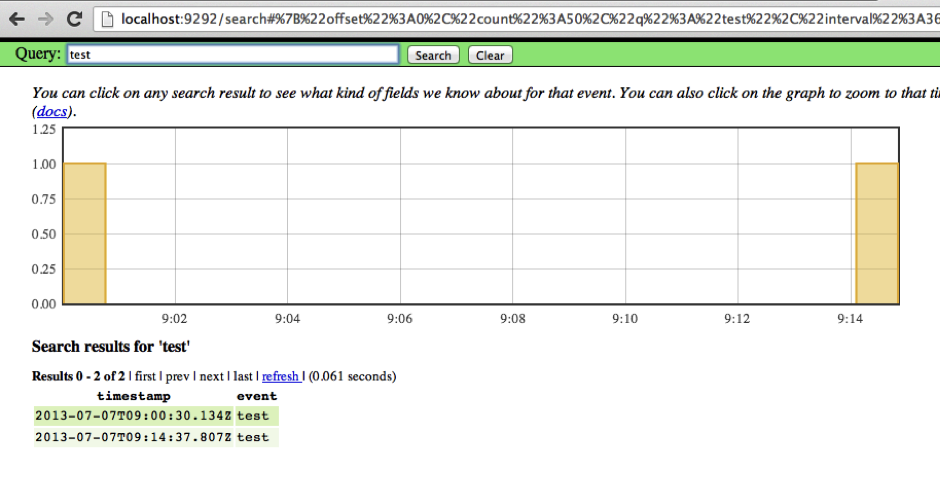
logstash (http://logstash.net) is a tool for managing events and logs. You can use it to collect different (distributed) logs, parse them, and store them for later use. Speaking of searching, logstash comes with a simple, but fine web interface for searching and drilling into all of your logs. It uses ElasticSearch under the hood. So, you can easily query through all your logs for specific errors or business analytics (e.g. searching for all lines matching an unique order id).
I never used logstash before. I really love it now! However, documentation is not perfect for getting started. So, two hints for newbies:
1) logstash uses ElasticSearch under the hood. However, you do not have to install it separately. It is included and can be used as embedded server.
2) I thought logstash can process every log file by default. However, your log files have to contain a specific structure or you have to configure logstash to know your custom log structure. Especially, if logstash does not know the correct structure of your timestamp, most features will not work. This was not obvious to me. It took me some time to find out that nothing is happening due to wrong log structures (no errors or exceptions came up, just nothing happened at all).
Apache Camel and Talend ESB do not offer support for logstash implicitly. One solution is to use Enterprise Integration Patterns (http://www.eaipatterns.com) such as Wire Tap or Message Store to implement logging. Afterwards, logstash can access and analyse these logs.
logstash is really awesome, but its real power can be reached by combining it with Kibana. So let’s go to the next section.
Kibana
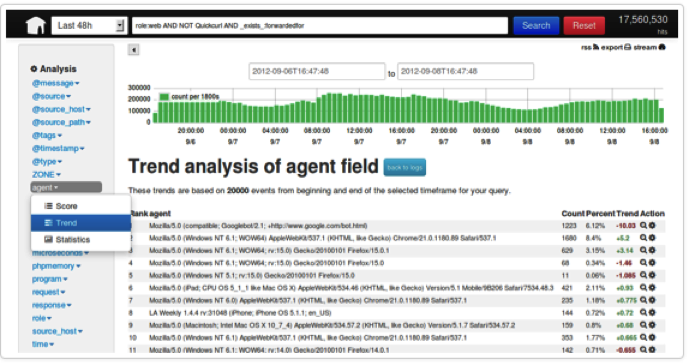
Kibana (http://three.kibana.org ) is a browser based analytics and search interface to logstash and other timestamped data sets stored in ElasticSearch. Kibana strives to be easy to get started with, while also being flexible and powerful, just like logstash and ElasticSearch.
Main difference to logstash is a much more powerful HTML5 based web interface. You can
- use multiple concurrent search inputs
- highlight to drill down bar charts
- create line charts, stacked, unstacked, filled or unfilled, with or without points
- create Pie and donut charts that compare top terms or the results of multiple queries
- create custom dashboards with multiple charts
- and much more…
Again, some hints for newbies (as documentation for installation and usage is very, very short without many important details, unfortunately):
1) Kibana uses logstash and ElasticSearch under the hood. Both are not included, but must be installed separately. As logstash contains an embedded ElasticSearch server, you can get started quickly by just installing logstash in advance.
2) Kibana installation is tricky! If you google, go to Kibana website and navigate to its installation guide (http://kibana.org/intro.html), you will have to install it via Ruby. As always on my Mac, I had some trouble installing Ruby software (version and compiler problems, etc.). But finally I made it… Just to find out that this is an old version. Accidentally, I came to www.three.kibana.org/intro.html, which is the real up-to-date version. Kibana 3 !!! Here, you do NOT need to install Kibana via Ruby. Just download the web application and deploy it to your web container (e.g. Jetty, Tomcat) or Java EE container (e.g. Glassfish, WebSphere). This is so simple and just works with no further configuration.
You can use Kibana to analyse and monitor your data as you do with logstash, i.e. you still have to use Enterprise Integration Patterns to log your data first. Afterwards, you can use Kibana’s web interface, which is much more powerful and comfortable than logstash.
Finally, great news for Talend users: Kibana (including ElasticSearch) will be integrated into Talend 5.4 for event logging, complex event processing and visual monitoring. I am really looking forward to this awesome feature!
Summary
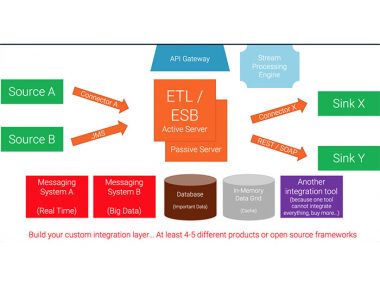
Your mission-critical projects need management and monitoring. Today, this is not just possible with complex and expensive tools of large vendors, but also with lightweight frameworks and products such as Apache Camel or Talend ESB. Management and monitoring of Apache Camel and Talend ESB integration routes and SOAP / REST web services is very easy. Several great alternatives are available. Once again, vendor-independent standards such as JXM show their benefits. You can use tooling which is available implicitly in the framework respectively product, or you can integrate your existing tooling very easily.
Feedback and other experiences or alternatives appreciated via comments or directly via @KaiWaehner / kontakt@kai-waehner.de / LinkedIn / Xing.
Best regards,
Kai Wähner
6 comments
Thank you for this overview.
Among the presented tools or others, is there any way to “multiplex some JMX information” for a central monitoring tool ?
Here is an example of what I call “multiplex JMX information” :
Apache ActiveMQ (AMQ) provides JMX attributes to check at the AMQ server level that there is a minimum amount of consumer (at least one) for each queue. For performance and licence cost reasons, it is not possible to configure the individual checking of this attribute for each queue in the centralized monitoring tool.
The objective is to generate in the centralized tool an alert when one of the queue doesn’t have any consumer.
This alert in the centralized tool does not have to indicate which queue is concerned by the alert even if it would naturally be a plus.
So we have to check at the activeMQ server the value of the JMX attribute for each queue and define for example a unique new JMX attribute to indicate if there is at least one queue without any consumer.
Any idea to do such configuration is welcome.
At least we can do it with specific Java/JMX development but for monitoring. It will work but we will have additional code to maintain for monitoring …
Ikun,
I have no JMX-specific good answer. I am not very experienced with Hyperic, Nagios and these tools.
A solution could be to write to some log (e.g. using some EIPs within a Camel route) when a queue has no consumer. You can visualize this to a dashboard easily using Kibana and react (or send an email to an admin) if no queue has a consumer.
Kai
Great little summary that has saved me a lot of reading. Sometimes as an Architect, I need only a summary of products as the concepts are familiar. this was a great article which really hit the spot.
Thanks.
Hi Kai,
when I understand it right, you have used Elastic + Logstash + Kibana (the ELK stack) for monitoring Apache Camel and Talend ESB. Have you ever thought about replacing Logstash by a Camel route for increasing performance? Since Camel 2.11, an elasticsearch end point is available; see http://camel.apache.org/elasticsearch.html. Note that Logstash and Elasticsearch are separate software nowadays.
Elasticsearch can be fed by any software component that sends the data in the right format. E.g. Beats can send data directly to Elasticsearch without passing Logstash, if no highly sophisticated translation is needed. Apache Camel could do so as well. I could imagine that the performance of Apache Camel can be tuned more easily compared to Logstash.
Thanks,
Oliver
Hi Oliver,
I think this can make sense, but not always. Logstash is built for ingesting log events. Thus, I would expect better performance and other advantages here.
In general, Camel might be the better alternative if you want to integrate non-log event to Elasticsearch.
It is definitely a good idea, and both options have their trade-offs, probably.
Kai
Hi Kai,
I had assumed that Apache Camel potentially has a better performance than Logstash. However, as long as this is not proven, that Apache Camel really has a better performance, it does not make sense to replace Logstash by Apache Camel for input sources Logstash can handle.
Yes, your are right: Camel might be the better alternative if you want to integrate input sources Logstash cannot handle today. Good hint.
BTW, nice blog post! I also love your comparison presentation between Apache Camel, Mule and Spring, e.g. on http://de.slideshare.net/KaiWaehner/camelone-2012-spoilt-for-choice-which-integration-framework-to-use.
Best Regards,
Oliver